| Learning Aims: |
|
| Materials: |
|
| Suggestions for use: |
|
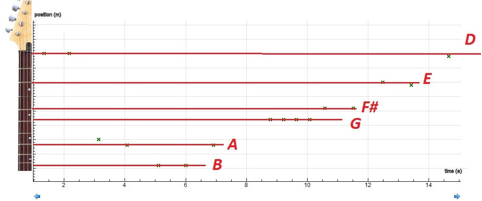
In this activity students analyse positions where a bass player places his fingers during playing different notes. The students use the graph to answer the given questions. During the activity they get a better understanding of what is showed in the graph. The questions 1 to 4 are easy to answer for most students. Question 5 goes a little deeper and requires some calculations. It is up to the teacher to decide how much help is needed here. Depending on the spirit in the class and the skills in music, the teacher can decide how much time is spend on question 6 (let the students guess which tune is played). Even make a contest out of it (be sure to remove the link to the answer in the worksheet) or let the students draw a graph for another simple tune. Answers to the questions in the worksheet: There are six different notes played (question 1) and the first time the A is played, the finger is a bit too high (question 2). When the finger is too high, the string is too long and the tone is too low (question 3). The semitone (question 4) between F# and G is also clear from this picture. In the picture below the graph of position of the finger of the bass player against time is combined with a picture of a guitar. The positions match the positions of frets of the guitar. The names of the tones played are also indicated.
Question 5: Going from the first notes (D) to the third note played (an A at t= 2 s) the frequency is multiplied by 1.5. This means that the remaining length of the string is 66,7 % of the original length. Thus, a difference of 33,3 % of string length is 32 cm (90-58). This means that the string has a length of 96 cm. In reality this length is a bit more, the data are a bit disturbed because the bass is moved during the video recording. However, the differences between theory and measurement are not that big (less than 10%). |
| Possible questions: |
|
